

Ten-Year US Treasuries: A Possible Regime Shift
Executive View
The sharp September advance in the 10-year US Treasury yield—from approximately 4.7% to 5.3%—may represent more than a short-term repricing. The technical backdrop remains consistent with an upward bias in long-term yields, while persistent fiscal deficits, heavy sovereign issuance, and higher global funding needs may reinforce that direction. This is a scenario-based market view, not a point forecast: pullbacks and consolidation phases should be expected within a broader uptrend.
Technical View
The 10-year Treasury yield has followed a broadly upward path since its pandemic-era low near 0.5% in 2020. The initial advance carried yields to around 5.0% in late 2023, followed by a correction that bottomed near 3.75% in late 2024. Yields then moved broadly sideways through July 2026 before accelerating to a new high of approximately 5.3% by the end of September 2026.
One possible Elliott Wave interpretation labels the 2020–2023 advance as a five-wave impulse and the 2023–2024 decline as an A–B–C correction. If this count is correct, the recent breakout may mark the beginning of a larger upward leg. Elliott Wave analysis is inherently interpretive, however, and should be used as a framework for scenarios rather than as a deterministic forecast.
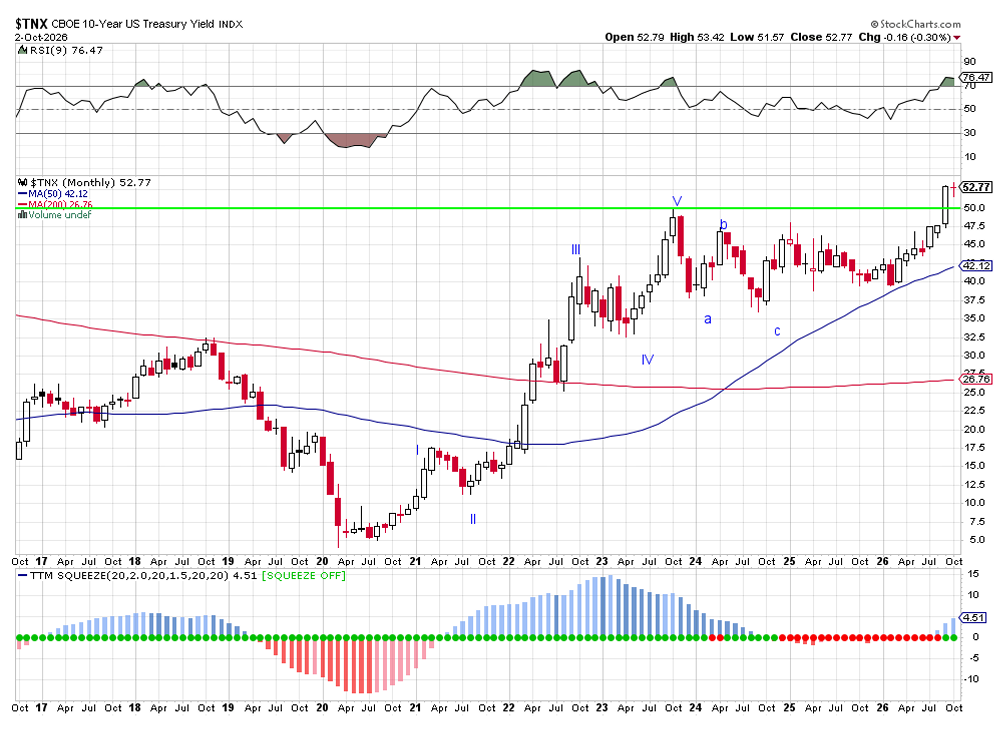
Chart 1: TNX monthly chart with possible Elliot Wave counts
Momentum and Volatility
-
Relative Strength Index
Following the 2023 peak and subsequent correction, monthly RSI remained above 30 through 2025 and 2026. The breakout to approximately 5.3% pushed RSI above 70, confirming strong upside momentum. At the same time, an RSI reading above 70 can increase the likelihood of a near-term pause or pullback; it should not be read as a guarantee of uninterrupted further gains.
-
TTM Squeeze
The TTM Squeeze identifies periods of volatility compression by comparing Bollinger Bands with Keltner Channels. In the chart, the prolonged sequence of red dots indicates compressed volatility, while the subsequent positive histogram bars are consistent with volatility expanding alongside higher yields. The indicator helps identify a transition from compression to expansion, but it does not independently establish direction or a price target.
Fibonnaci Retracement
The correction from the late-2023 yield high retraced less than 38.2% of the prior 2020–2023 advance. Shallow retracements can be characteristic of durable trends because they suggest that selling pressure was insufficient to reverse the preceding move decisively. This observation supports, but does not by itself prove, the case for continuing upside momentum in yields.
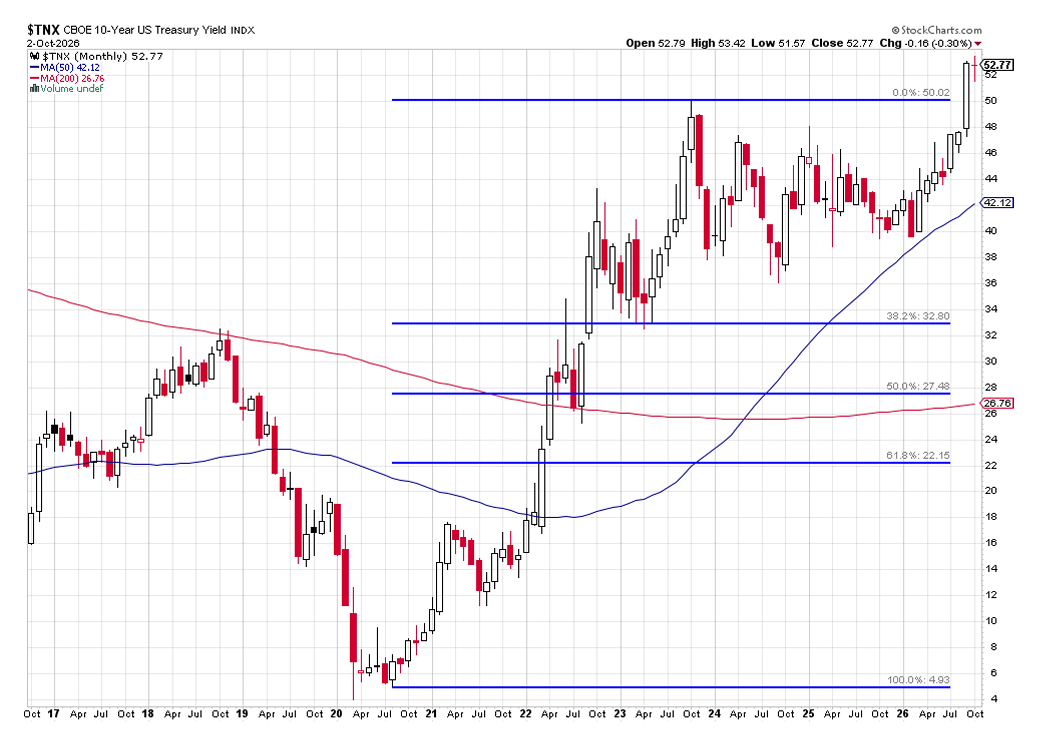
Chart 2: TNX Monthly chart showing Fibonacci retracement.
Macro Context
Several forces may be contributing to upward pressure on longer-dated yields: persistent US fiscal deficits, elevated Treasury issuance, higher global sovereign borrowing requirements, geopolitical uncertainty, and shifts in investor demand at Treasury auctions. Higher energy prices can also affect inflation expectations and term premium. These factors are interrelated, and their effects may vary over time.
Private-sector funding needs may add to the pressure at the margin. In particular, hyperscaler and AI-related capital expenditure could increase financing demand during the current buildout cycle. That influence may prove more cyclical than fiscal supply, whereas structural budget deficits and continued government borrowing could be more durable drivers of the long-end yield environment.
A higher yield means a lower price for an existing Treasury security. Accordingly, the thesis is bearish for duration-sensitive Treasury positions, although the pace and path of any yield increase will depend on inflation, growth, Federal Reserve policy, auction demand, and fiscal developments.
Potential Upside Scenarios
An Elliott Wave projection should be calculated in yield changes—basis points or percentage points—rather than by simply adding yield levels. Under an extended third-wave interpretation, the magnitude of the initial advance can be measured and applied to the end of the corrective phase. This approach can imply substantially higher yields than the 2023 high, but its precision is limited and depends heavily on the chosen wave count.
The 10–11% area should therefore be regarded as an extreme, long-horizon technical scenario rather than a central forecast or a minimum target. Such an outcome would likely require a sustained upward shift in some combination of inflation expectations, real yields, term premium, fiscal-risk perceptions, or global demand for duration. It could take months or years to develop, if it develops at all.
The more immediate analytical task is to monitor whether yields can hold above the previous 5.0% area and sustain a break above the recent 5.3% high. A decisive reversal below those levels, particularly if accompanied by weakening momentum and improved auction demand, would weaken the bullish-yield interpretation.
Conclusion
The balance of technical and macro evidence favors a higher-yield regime for the 10-year Treasury, with intermittent corrections likely along the way. The recent breakout, persistent momentum, shallow prior retracement, and ongoing fiscal backdrop collectively support that view. However, the thesis should be managed as a set of scenarios with clearly defined monitoring levels—not as an unconditional prediction of continuously rising yields.
Methodological Note
This note is based on the monthly chart framework provided, including the stated RSI, TTM Squeeze, Fibonacci, and Elliott Wave observations. Technical analysis is probabilistic and subjective. This material is for market commentary and informational purposes only; it is not investment advice or a recommendation to buy or sell any security.
This information is for educative purposes only. If you have any questions or seek clarification please feel free to contact me at info@skmarketisghts.com.
Sowmi Krishnamurthy Ph. D., CMT
SK Market Insights Ltd
August 8, 2026
