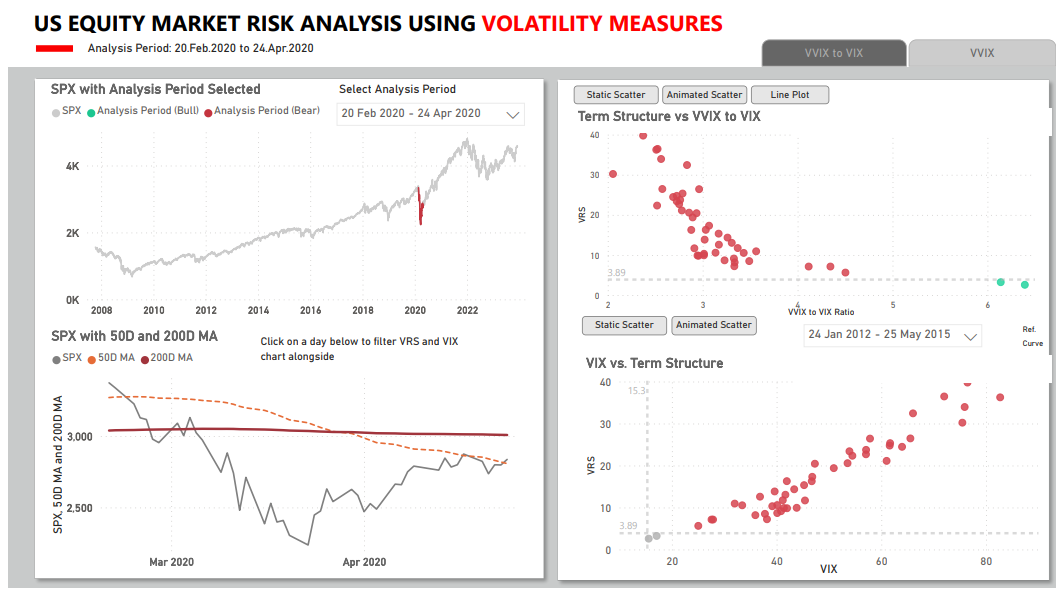
SK Market Insights provides a volatility based risk analysis using VIX, VVIX and VIX futures term structure. A sample of the analysis is shown below where the first chart tracks the daily closing prices of the SPX Index, broken down into rally and correction periods (left) and the risk analysis during these periods (right) as measured using VIX, VVIX and term structure. Sustained rallies occur during periods of low volatility and these charts enable volatility tracking to identify suitable conditions for market entries and exits. An expanded view is shown in the second chart below where the seven day movement of VIX vs VIX futures term structure deviation from a reference period representing favourable rally conditions. Further details available on inquiry. Please write to info@skmarketinsights.com.