
Archer Daniels Midland – Follow up: Upside Target met
The formation of a double top in Archer Daniels Midland (symbol: ADM) was identified in an earlier blog. The double top was confirmed by a break of the neckline which enabled calculation of a downside target as outlined earlier. Prices subsequently rebounded from this level to test its 50-day simple moving average (SMA). Additionally, a downtrend line from the peak of Nov. 23 served as further resistance to a move higher. It was posited then that a move over the 50 day SMA and a break of the trendline would result in a further move higher to test the 200-day SMA as a sign of prices gaining momentum.
Subsequently, prices did move above the 50-day SMA and after breaking the downtrend line moved higher. These developments and associated observations are discussed using the chart below.
Following a decisive break of the down trendline in August at $54, prices moved higher to test the 200-day SMA at $64.92 in late August. After several unsuccessful attempts to breakthrough this resistance, prices retreated in late October. This is further confirmed by a divergence in the RSI as well as a long dark candle in late October. The rally from the low of $42 in April to the 200-day SMA at $64.92 was deemed to be over for now. The inability of prices to close above the 200-day SMA points to strong resistance at this level, due to factors such as investors seeking further proof of internal business improvement initiatives as well as market factors in the agricultural sector.
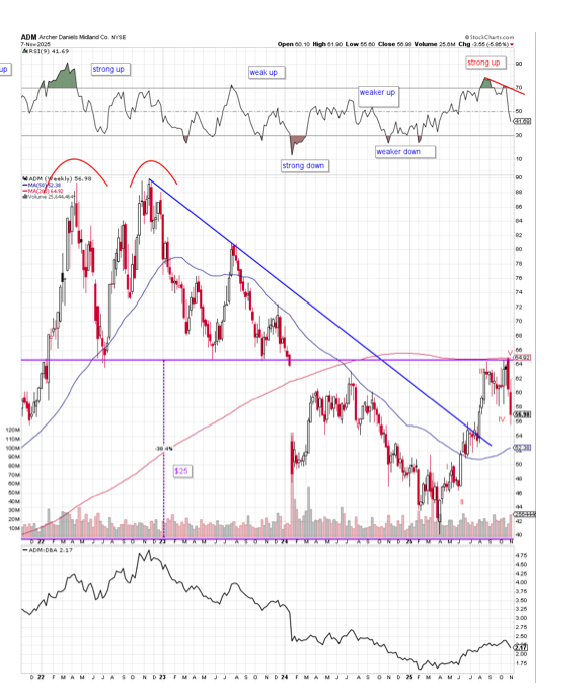
A closer analysis of the move from the low of $42 using Elliot Wave theory indicates a five-wave impulse move from this low as shown by the Roman numerals in red. Such a move implies a change in character from a downtrend to an uptrend enhancing the view that a bottom is in place for now. An a-b-c type correction can be expected following the bullish I-II-III-IV-V wave sequence (red) which would then set itself up for the next impulse move higher and a retest of the 200-day SMA.
Holders of a long position in ADM at $54 would have been able to secure a 20% return over a three-month period by liquidating their position at $64 between August and October 2025.
This example illustrates the power of technical analysis as a tool that could be effectively harnessed to enhance successful outcomes.
This illustration is for educative purposes only. If you have any questions or seek clarification please feel free to contact me at info@skmarketisghts.com
Sowmi Krishnamurthy Ph. D., CMT
SK Market Insights Ltd